Data screening is the process of ensuring that your data is clean and is ready for exploratory factor analysis (EFA). The purpose is to ensure that data is usable, reliable, and valid for testing the causal theory. This step-by-step guide will focus on three main issues that need to be addressed when cleaning data for use in the EFA. These are: (A) Missing data in rows, (B) Unengaged responses, (C) Outliers for continuous variables, and (D) Skewness and kurtosis.
A. Missing Data in Rows
Purpose: There should be no missing data in your dataset to estimate modification indices, run a bootstrap, etc. in AMOS. Some functions can’t be run in AMOS if you have missing values.
Dataset to use: SPSS raw dataset
- Trim the dataset.
- Retain only the variables that are in your hypothesized model.
- Save as a new file 1 Dataset trimmed
- Copy all cases in a blank excel file.
- Use the =COUNTBLANK function to count missing values.
- Sort the results from largest to smallest
- Make sure you have the unique identifier to trace what to delete in SPSS (i.e. variable ID)
- Inspect every respondent or case with missing values.
- If there are more than 20% of the responses missing, you may delete that case.
- If not more than 5% of the responses are missing, you may just impute those values.
- To find variables with missing values:
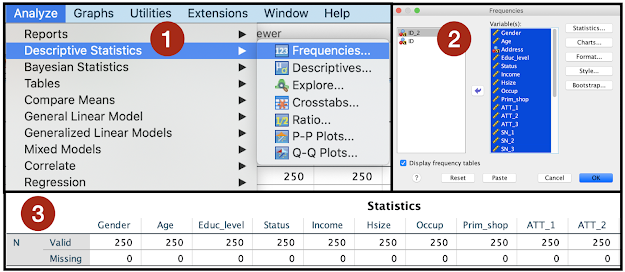
- Go back to SPSS trimmed dataset — Analyze — Descriptives — Frequencies.
- Throw all the variables except ID — Check the Display frequencies tables.
- In the output, go to Statistics -- Note the variables which have missing values.
- Impute values depending on the type of variable. Replace the existing variables.
- For ordinal variables, impute the median.
- Go to Transform -- Replace missing values -- Throw ordinal variables with missing values -- Replace existing variables -- Method: Median of nearby points -- All points -- Change -- OK.
- For continuous variables, impute the mean.
- Go to Transform -- Replace missing values -- Throw continuous variables with missing values -- Replace existing variables -- Method: Mean of nearby points -- Series mean -- Change -- OK.
- Save as a new file 2 Dataset no missing
- Report in your paper the following:
- How many variables have missing values? Percent of the total?
- How did you replace them? Median, mean?
- What rows did you delete and why? Percent of the responses missing?
 |
| Imputing variables with missing values |
B. Unengaged Responses
Purpose: To delete respondents who answer the exact same value at every question. These respondents seem to be not really paying attention to the questionnaire. This is applicable to variables with responses in Likert scale only.
Dataset to use: Dataset no missing
- In SPSS, copy all cases and paste them in a blank excel tab.
- Identify those variables with responses in Likert scale.
- Make a new column at the end named STDEV.
- Use the =STDEV.P function and compute for all identified variables at all cases
- This will check for cases with zero variance.
- Highlight those with zero values.
- Remove those cases with zero STDEV.P values.
- It is justifiable to remove them as they are unengaged.
- Report in your paper the following:
- How many respondents were unengaged?
- What was the reason for removing them?
C. Outliers on Continuous Variables
- In SPSS, go to Graphs -- Chart builder.
- Select Scatter plot (drag into the graph area).
- Assign the variable to be investigated in the Y-axis, and ID in the X-axis.
- Look at the ID with the outlier data.
- Think if it is possible to have that data.
- If it is possible, delete that case.
- If it is not possible, you can either delete or impute the value as the mean of all the cases.
- It is justifiable to do so as the respondent may have just committed a mistake in filling up.
- For those who did not respond, take the mean of all the cases as well.
 |
| Graphing for outliers in SPSS |
D. Skewness and Kurtosis
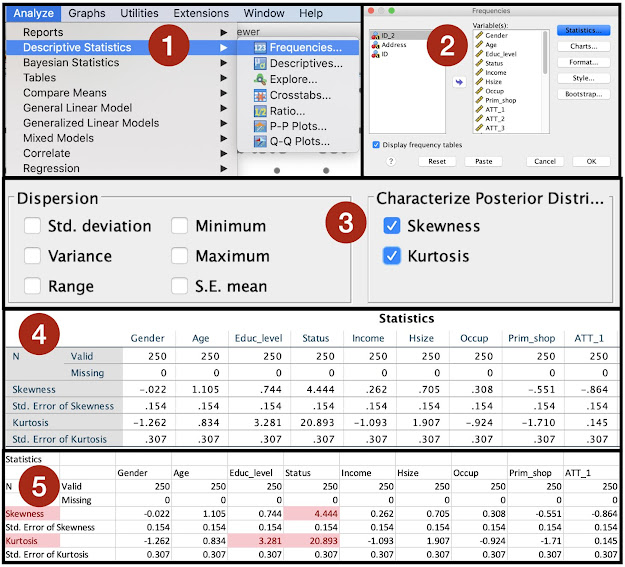
- In SPSS, go to Analyze -- Descriptives — Frequencies.
- Throw all variables except ID -- Statistics.
- In Characterize Posterior Distribution:
- Check on Skewness; and
- Check on Kurtosis.
- In the Outputs, go to Statistics -- Copy the table.
- In Excel, paste the table and do the following:
- Highlight the Skewness and Kurtosis values.
- Go to Conditional Formatting -- Highlight cell rules.
- Greater than 3; and
- Less than -3.
- Look over the cases.
- Continuous variables may have kurtosis issues.
- Ordinal variables should have no issues.
- Drop the variable if it is highly non-normal.
- You can drop as long as you still have other variables remaining (at least 2 variables in a construct, but 3 is advisable)
- Report the item that was highly skewed and delete.
 |
| Detecting skewness and kurtosis in SPSS |

The content is very informative & helpful....got a good information.....
ReplyDeleteThank you Norden. Good luck on your research.
DeleteDear Dr Can you please share the link where I can read your article Community enterprise consumers’ intention to purchase organic rice in Thailand: the moderating role of product traceability knowledge", British Food Journal, Thanks. Prasad
ReplyDeletehttps://doi.org/10.1108/BFJ-02-2021-0148
ReplyDeleteThis is helping me sooo much with my thesis! THANK YOU
ReplyDelete