Testing the causal model in AMOS may involve having moderator variables that are categorical. This can be done through Multi-group analysis. In cases where available data are continuous (e.g. age, years of experience, etc.), conducting Multi-group analysis is also possible. However, you need to convert first these variables into categorical ones, for them to be used in AMOS.
For this example:
Age is our continuous variable. We will code high and low values of age.
The steps would involve A) Computing for the mean score, and B) Recoding into a different variable. The following sections show the step-by-step process.
A. Compute for the Mean Score
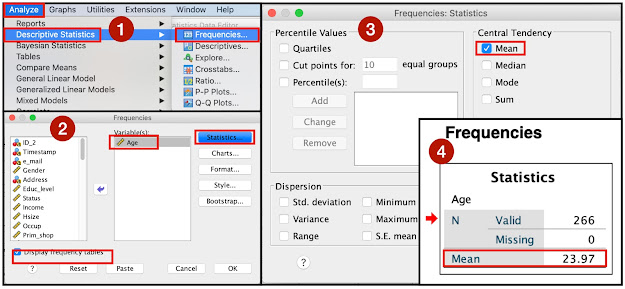
- Go to 'Analyze' -- Descriptive Statistics -- Frequencies. A window will appear.
- Throw in the continuous variable.
- Check 'Display frequency tables.
- Click 'Statistics'.
- In the 'Central Tendency' section, check for the mean score.
- Note: It actually depends on how will you categorize this variable.
- For this example, we will use the mean.
- Other literature, use the median score.
- In the 'Output', go to the 'Frequencies' section and then take note of the mean.
B. Recode into Different Variable
- Go to 'Transform' -- Recode into Different Variables.
- Throw in the continuous variable.
- In the 'Output Variable' section, fill in the name and label.
- In the example, I named it 'AgeCat' to mean the knowledge category.
- Click 'Change'.
- Click 'Old and New Values', and a window will appear.
- Assign new values.
- In the 'Old Value' section. Choose 'Range, value through HIGHEST'.
- Input the mean Age.
- In the 'New Value' section, set the value as 1.
- Click 'Add'.
- The result will appear in the 'Old --> New' section.
- Go back to the 'Old Value Section'. This time, choose 'All Other Values'.
- In the 'New Value' section, set the value as 2.
- Click 'Add'.
- The result will appear in the 'Old --> New' section.
- Click 'Continue'.
- Check in the 'Variable View' if a new variable is added.
- Change the measurement level into 'scale'.
- Set the 'Value Labels' base on your category.
C. Check for the Frequency (Optional)
- Go to 'Analyze' -- Descriptive Statistics -- Frequencies.
- A window will appear.
- Throw in the newly-created categorical variable.
- Check 'Display frequency tables.
- In the 'Output', go to the 'Frequencies' section.
- You will see the percentage distribution of each category you created.
Hope this helps. :)


Very useful, sir. Thanks for sharing your knowledge.
ReplyDelete