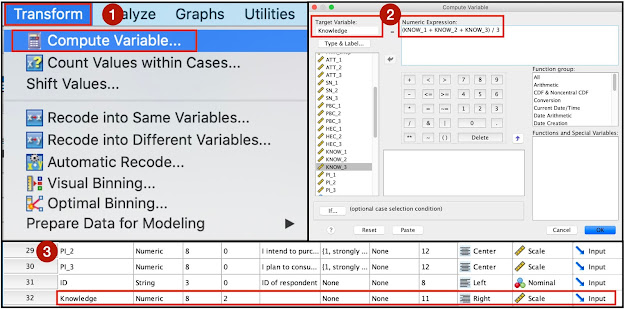
This is applicable if you wish to convert a group of Likert scale responses from a single construct into one categorical variable.
For this example:
We have one construct 'Knowledge' which is measured by three items - KNOW_1, KNOW_2, and KNOW_3. We will have a single variable to represent these three measurement items, and we will code high and low values of knowledge.
The steps would involve A) computing for the composite score, B) computing for the mean score, and C) recoding into a different variable. The following sections show the step-by-step process.
A. Compute for the Composite Score
- Go to Transform -- Compute variable. A window will appear.
- Compute the variable to represent the composite score.
- Fill in the target variable box.
- Compute for the average value of that variable in the 'Numeric expression' box.
- Throw in the variables.
- Use the buttons in the window to compute.
- Click OK.
- Check in the 'Variable View' if a new variable is added.
- Change the measurement level into 'scale' if it is not.
B. Compute for the Mean Score
- Go to 'Analyze' -- Descriptive Statistics -- Frequencies. A window will appear.
- Throw in the computed variable.
- Check 'Display frequency tables.
- Click 'Statistics'.
- In the 'Central Tendency' section, check for the mean score.
- Note: It actually depends on how will you categorize this variable.
- For this example, we will use the mean.
- Other literature, use the median score.
- In the 'Output', go to the 'Frequencies' section and then take note of the mean.
C. Recode into a Different Variable
- Go to 'Transform' -- Recode into Different Variables.
- Throw in the variable you computed.
- In the 'Output Variable' section, fill in the name and label.
- In the example, I named it 'KnowCat' to mean the knowledge category.
- Click 'Change'.
- Click 'Old and New Values', and a window will appear.
- Assign new values.
- In the 'Old Value' section. Choose 'Range, value through HIGHEST'.
- Input the mean score.
- In the 'New Value' section, set the value as 1.
- Click 'Add'.
- The result will appear in the 'Old --> New' section.
- Go back to the 'Old Value Section'. This time, choose 'All Other Values'.
- In the 'New Value' section, set the value as 2.
- Click 'Add'.
- The result will appear in the 'Old --> New' section.
- Click 'Continue'.
- Check in the 'Variable View' if a new variable is added.
- Change the measurement level into 'scale'.
- Set the 'Value Labels' base on your category.
D. Check for the Frequency (Optional)
- Go to 'Analyze' -- Descriptive Statistics -- Frequencies. A window will appear.
- Throw in the newly-created categorical variable.
- Check 'Display frequency tables.
- In the 'Output', go to the 'Frequencies' section.
- You will see the percentage distribution of each category you created.
Hope this helps. :)


Comments
Post a Comment